|
|
|
|
|
T-RMSD
A Fine-Grained Structure Clustering Method |
|
|
|
|
|
What is T-RMSD?
|
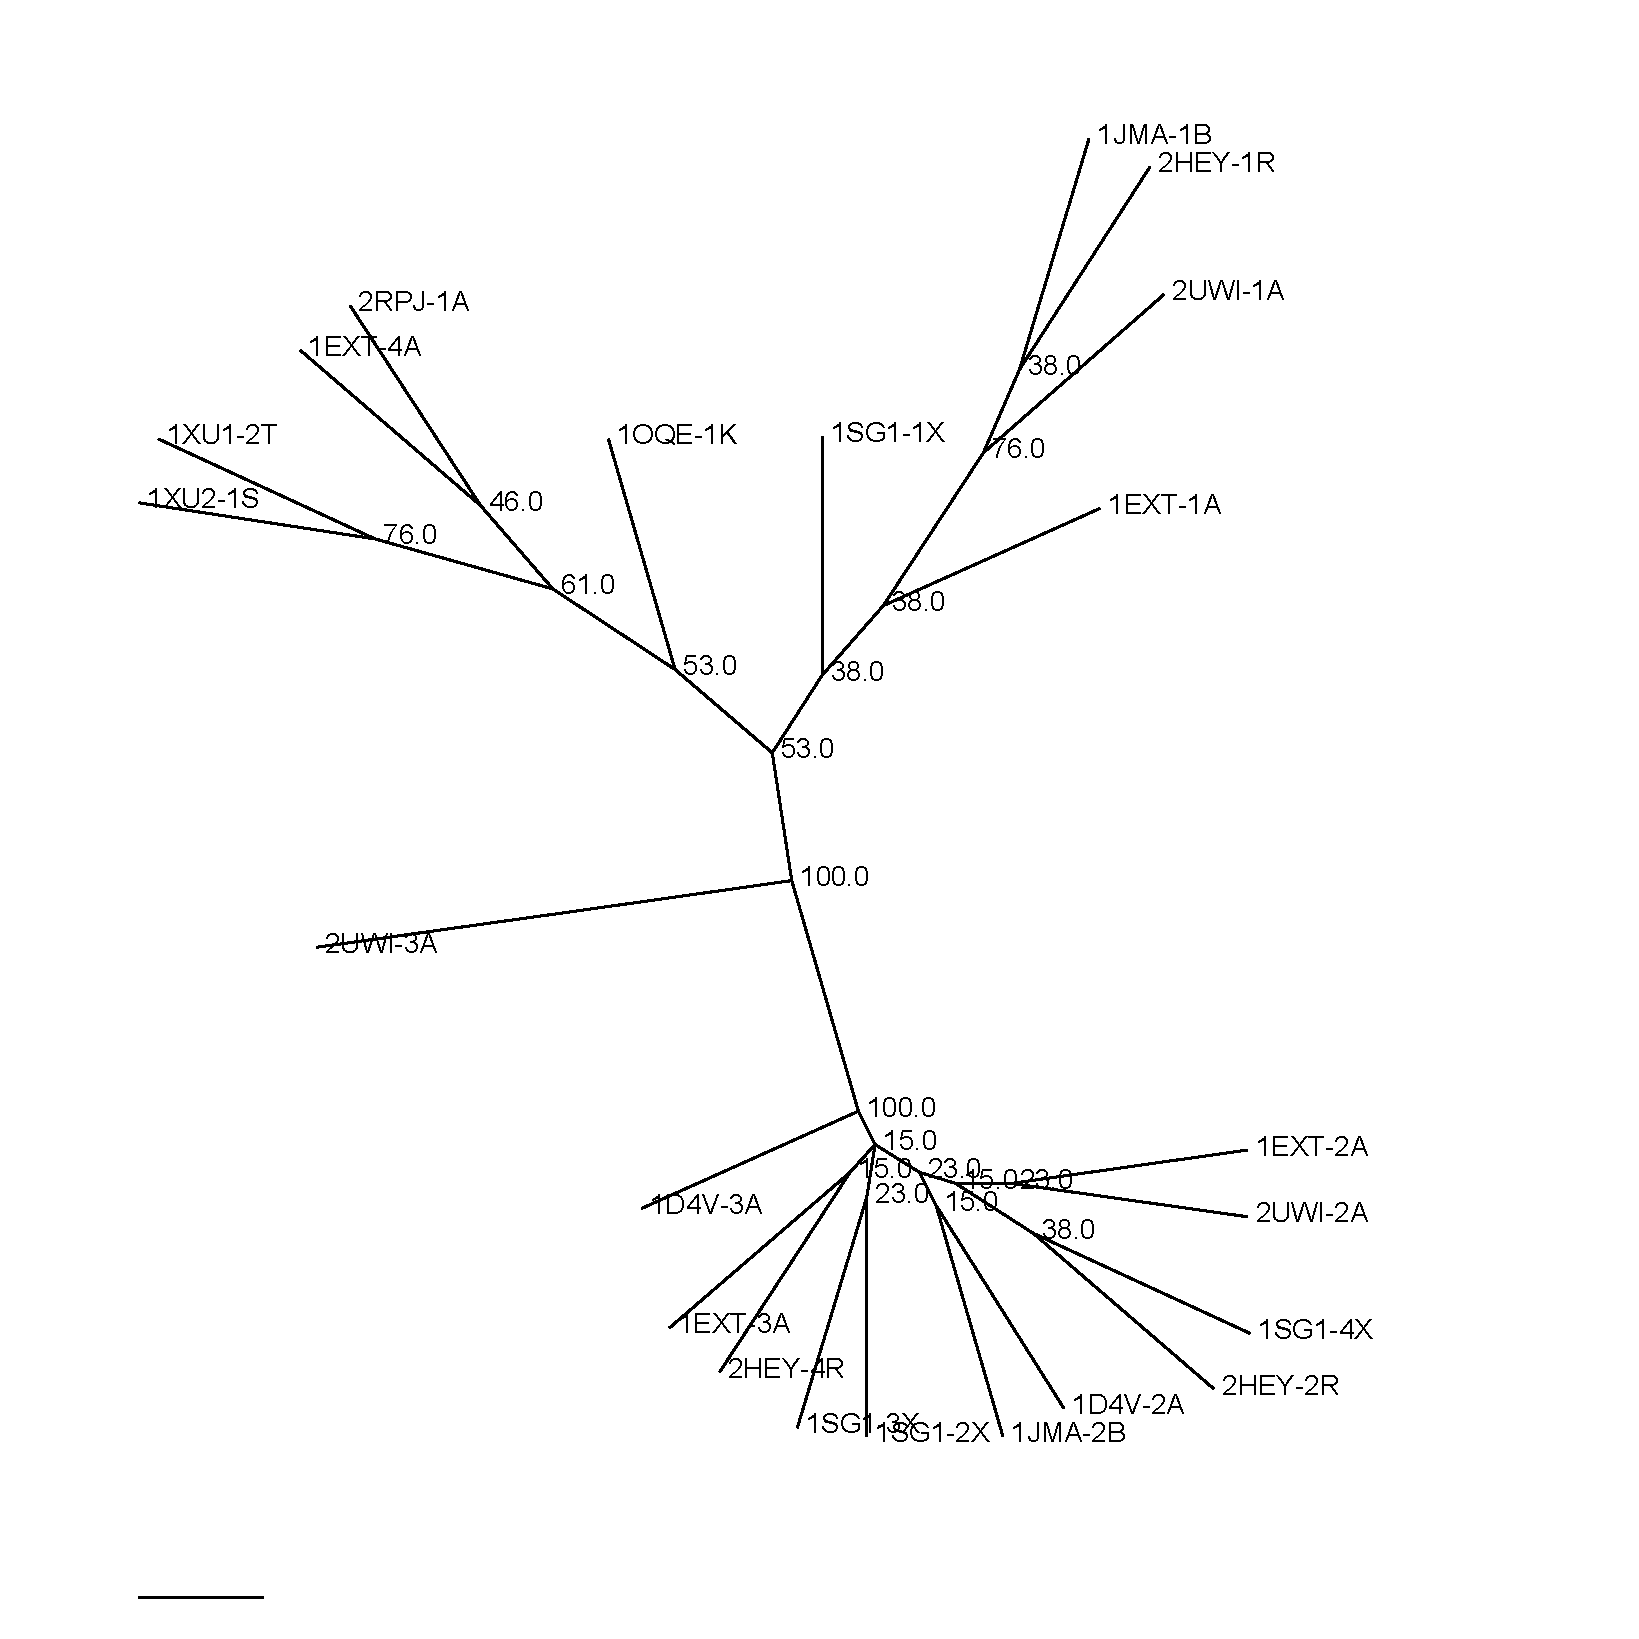
T-RMSD (Tree based on Root Mean Square Deviation) is a distance RMSD (dRMSD) based method which generate Structural Trees (analogue to phylogenetic tree) to determine fine-grained structural variations associated with a given Multiple Sequence Alignment (generated by the user using the method of is choice). It is part of the T-Coffee distribution. The specificity of T-RMSD compared to other structural comparison methods stems from its capacity to generate a structural tree with values equivalent bootstrap values supporting the structural clustering. Such clustering is achieved by the construction of matrixes of distances, calculated between equivalent residues as defined by the ungapped column of the given MSA. The resulting matrixes are then combined using the CONSENSE program from the PHYLIP package to generate a consensus structural tree with equivalent bootstrap values supporting each node(from 0 to 100; 100 indicating that all positions support the clustering).
A list of related publications is available here and there. The following presentation provides an overview of the algorithm and its validation.
|
|
|
|
|
|
- T-RMSD is a special option allowing a fine-grained structural clustering of a given group of related proteins (i.e. protein domains).
Download the latest T-Coffee version here.
|
|
|
|
|
1-Follow the standard T-Coffee installation procedure.
|
|
2-Install all the multiple sequence alignment packages you want to construct your Multiple Sequence Alignment.
You should also take a look at the T-Coffee Technical Documentation. The latest list of packages interfaced with T-Coffee can also be obtained with the simple intruction
t_coffee > package_list
|
|
|
|
|
|
Given a Multiple Sequence Alignment foo.aln and a template file foo.template_list (similar to Expresso procedure; it corresponds to the association between sequences contained in the MSA and the PDB files used for the distances calculation) T-RMSD outputs a file named foo.html that contains a color coded indication of the ungapped column supporting the structural clustering. Gapped columns are not colored as they are not used to establish the clustering. Red brick columns indicate positions with a strong support to the clustering, while blue regions exhibit a low support. Red brick columns represent the most structurally discriminating positions. Unlike alginments generated using T-Coffee, there is no consistency score (0-100) for each sequence of the MSA. T-RMSD also outputs several files named foo.struc_tree10, foo.struc_tree50, foo.struc_tree100 which corresponding to Neighbour Joining files, that can be used to build the structural tree using the software of your choice. The indication 10, 50 or 100 represent the pourcentage of ungapped columns used to generate the clustering.
|
|
|
|
The full documentation is on the T-Coffee Homepage. But the following shortcuts may be useful.
|
| To run a T-RMSD from a given MSA, use the following |
t_coffee -other_pg trmsd foo.aln -template_file foo.template_list -mode msa2tree
|
|
Sample Datasets are available from: here |
|
|
|
|
|
|
|
|
|
Our projects relie on your feeback. Please send me an
E-mail if you wish to make a request, a comment, or report a bug!
				  *******************************************

				  Dr. Cedric Notredame, PhD.

				  Group Leader

				  Comparative Bioinformatics Group

				  Bioinformatics and Genomics Programme

				  Center for Genomic Regulation (CRG)

				  Dr Aiguader, 88

				  08003 Barcelona

				  Spain

				  Email:  cedric.notredame@gmail.com

				  HOME :  http://www.tcoffee.org/homepage.html

				  GROUP:  CRG

				  Phone:  +34 933 160 271

				  *******************************************
|
|
|
|